Top 5 React Stock Chart Libraries for 2025: A Developer’s Guide
Dive into the world of modern React Stock Chart Libraries and discover how they’re revolutionizing financial data visualization. With real-time updates and interactive features, these tools are essential for any developer looking to build powerful financial applications. Let’s explore the key advancements and the top five libraries that are setting the standard in 2025.
Key Advancements in React Stock Chart Libraries
Modern React Stock Chart Libraries are packed with features designed to enhance performance, usability, and customization. Here are some of the key advancements:
- Improved Performance: Efficient real-time data streaming ensures smooth updates, even with high-frequency stock movements.
- Mobile-First Design: Touch-friendly interactions and responsive layouts provide a seamless experience across all devices.
- Advanced Customization: Fine-tune every aspect of your charts, from colors and fonts to grid lines and annotations.
- Expanded Chart Types and Indicators: A wide range of chart types and built-in technical indicators for comprehensive analysis.
Top 5 React Stock Chart Libraries
- Syncfusion® React Stock Chart: Known for its robust toolset, multiple chart types, and built-in technical indicators.
- Highcharts Stock: Offers a sleek interface and robust functionality for analyzing stock trends and live data updates.
- amCharts 5 Stock Chart: Ideal for apps requiring smooth animations and highly customizable visualizations.
- AnyChart® React Stock Chart: Supports large datasets with high performance and offers over 20 technical indicators.
- CanvasJS® React Stock Chart: Lightweight and high-performance, known for fast rendering and smooth animations.
Library Deep Dive
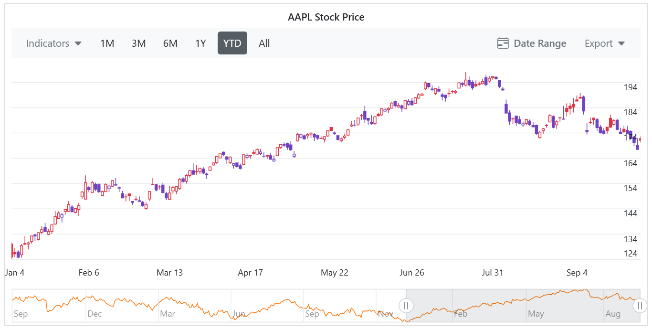
Syncfusion® React Stock Chart
The Syncfusion® React Stock Chart stands out with its extensive features, including multiple chart types and built-in technical indicators. It’s a robust choice for any financial application.
- Key Features: Multiple chart types, built-in technical indicators, multiple axis options, rich interactivity, and real-time streaming support.
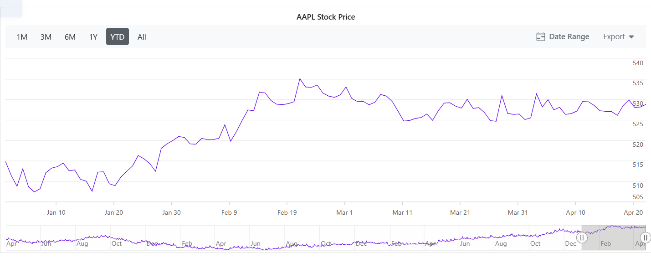
Highcharts React Stock Chart
Highcharts offers a user-friendly API and robust functionality, making it a great choice for analyzing stock trends and live data.
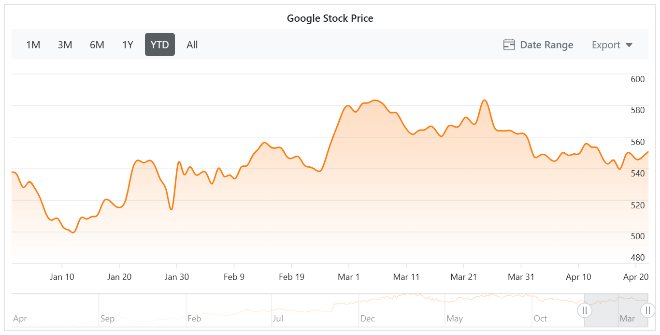
amCharts 5 Stock Chart
amCharts 5 is perfect for applications that require smooth animations and highly customizable visualizations.
AnyChart React Stock Chart
AnyChart excels in handling large datasets and offers over 20 technical indicators.
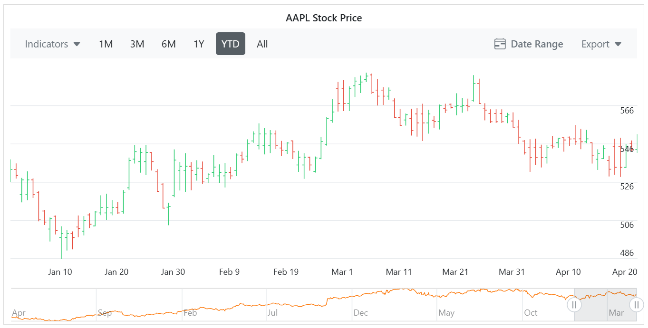
CanvasJS React Stock Chart
CanvasJS is known for its lightweight design and fast rendering, making it ideal for applications that require smooth performance.
Conclusion
Choosing the right React Stock Chart Library depends on your specific project requirements. Whether you need robust features, smooth animations, or high performance, there’s a library that fits your needs.
Related Resources
- Syncfusion® React Stock Chart Documentation
- Syncfusion® support forum
- Syncfusion® support portal
- Syncfusion® feedback portal
Open-Ended Questions
- What factors do you consider when choosing a stock chart library for your project?
- How do you see the future of financial data visualization evolving?
Original Article: Top 5 React Stock Chart Libraries for 2025